Browsing Players in a Library
The real-life statistics and ratings for players in the active library can be viewed in the Browse Real Life Stats pane. There are three tables located on this pane that contain the real-life batting, fielding, and pitching statistics for all active players in the current library (the number of players in the list is shown in parenthesis at the top of each table). All event probabilities and ratings shown in this pane are historically normalized (see Explaining Normalization for more information). The font size for these three tables can be customized using the Options->General Options->Other menu item.

Most of the statistics shown in these tables are self-explanatory. However, a few of the statistics and ratings are calculated using the player's real-life statistics and form the foundation for how the player will perform in a simulated game. These calculated statistics deserve some extra attention and are described in more detail below.
Calculated Batting Statistics and Ratings
| Special Batting Statistics | ||
| Statistic | Description | Cross References |
| DRAT | The primary statistic used by the computer manager to select players during a draft and make decisions during a game. For batters, this statistic represents the number of runs a hitter contributes to his or her team. The larger the number, the better the rating. | How Ratings are Calculated |
| SO% | The odds that a batter will strikeout. If a player's name is displayed in red italic font, it means that this statistic has been normalized due to a lack of playing time. | Player Cards, How Basic Probabilities are Calculated Explaining Normalization Normalize Options |
| Out% | The odds that a batter will produce an out, other than a strikeout. If a player's name is displayed in red italic font, it means that this statistic has been normalized due to a lack of playing time. | Player Cards, How Basic Probabilities are Calculated Explaining Normalization Normalize Options |
| BB% | The odds that a batter will walk. If a player's name is displayed in red italic font, it means that this statistic has been normalized due to a lack of playing time. | Player Cards, How Basic Probabilities are Calculated Explaining Normalization Normalize Options |
| 1B% | The odds that a batter will hit a single. If a player's name is displayed in red italic font, it means that this statistic has been normalized due to a lack of playing time. | Player Cards, How Basic Probabilities are Calculated Explaining Normalization Normalize Options |
| 2B% | The odds that a batter will hit a double. If a player's name is displayed in red italic font, it means that this statistic has been normalized due to a lack of playing time. | Player Cards, How Basic Probabilities are Calculated Explaining Normalization Normalize Options |
| 3B% | The odds that a batter will hit a triple. If a player's name is displayed in red italic font, it means that this statistic has been normalized due to a lack of playing time. | Player Cards, How Basic Probabilities are Calculated Explaining Normalization Normalize Options |
| HR% | The odds that a batter will hit a home run.. If a player's name is displayed in red italic font, it means that this statistic has been normalized due to a lack of playing time. | Player Cards, How Basic Probabilities are Calculated Explaining Normalization Normalize Options |
| Stl | The steal rating for a player. This represents the odds that a batter will be able to steal second base given he gets a good lead. If the runner does not get a lead they will not be able to attempt a steal until the next batter comes to the plate. | How Ratings are Calculated |
| Ld | The lead rating for a player. This represents the odds that a batter will be able to get a good lead and attempt a steal. | How Ratings are Calculated |
| Bnt | The bunt rating for a player. This represents the odds that a batter will be able to successfully execute a sacrifice bunt. | How Ratings are Calculated |
Calculated Pitching Statistics and Ratings
| Special Pitching Statistics | ||
| Statistic | Description | Cross References |
| DRAT | The primary statistic used by the computer manager to select players during a draft and make decisions during a game. For pitchers, this statistic approximates a pitcher's ERA by eliminating the effect fielding may have played on the actual ERA The smaller the number, the better the rating. | How Ratings are Calculated |
| SO% | The odds that a pitcher strikeout a batter. If a player's name is displayed in red italic font, it means that this statistic has been normalized due to a lack of playing time. | Player Cards, How Basic Probabilities are Calculated Explaining Normalization Normalize Options |
| Out% | The odds that a pitcher will get a batter out, other than a strikeout. If a player's name is displayed in red italic font, it means that this statistic has been normalized due to a lack of playing time. | Player Cards, How Basic Probabilities are Calculated Explaining Normalization Normalize Options |
| BB% | The odds that a pitcher will walk a batter. If a player's name is displayed in red italic font, it means that this statistic has been normalized due to a lack of playing time. | Player Cards, How Basic Probabilities are Calculated Explaining Normalization Normalize Options |
| 1B% | The odds that a pitcher will give up a single. If a player's name is displayed in red italic font, it means that this statistic has been normalized due to a lack of playing time. | Player Cards, How Basic Probabilities are Calculated Explaining Normalization Normalize Options |
| 2B% | The odds that a pitcher will give a double. If a player's name is displayed in red italic font, it means that this statistic has been normalized due to a lack of playing time. | Player Cards, How Basic Probabilities are Calculated Explaining Normalization Normalize Options |
| 3B% | The odds that a pitcher will give up a triple. If a player's name is displayed in red italic font, it means that this statistic has been normalized due to a lack of playing time. | Player Cards, How Basic Probabilities are Calculated Explaining Normalization Normalize Options |
| HR% | The odds that a pitcher will give up a home run.. If a player's name is displayed in red italic font, it means that this statistic has been normalized due to a lack of playing time. | Player Cards, How Basic Probabilities are Calculated Explaining Normalization Normalize Options |
| Dur | A pitchers durability followed by the pitchers current fatigue. The durability is the maximum number of batters faced before the pitcher can be considered tired. Fatigue is the number of batters faced by the pitcher this season, minus any rest since the pitcher's last start. For example, a pitcher with a durability of (30/16) can face 30 batters before they get tired and they have already faced 16 batters. | How Ratings are Calculated |
Fielding Ratings
The fielding table shows a players fielding rating at each position. Fielding ratings represent the odds that a player will make an error at the specified position.
Different font styles, weights, and colors are used to indicate additional information about the rating. Specifically, ratings will be displayed using italics if a player did not play at the specified position. The player's primary position (the position they played most at) will be displayed using a bold font. Finally, ratings displayed in red indicate that the player did not meet the the minimum number of chances at the specified position, and therefore the rating has been normalized. Please see How Ratings are Calculated, Explaining Normalization, and Normalize Options for more information about how fielding ratings calculated and used.
Reordering Columns
It is possible to reorder the columns in both the batter and pitcher statistical tables.. To reorder the columns, just drag the columns to the location you want. The column order you create will automatically be saved when you exit Digital Diamond Baseball.
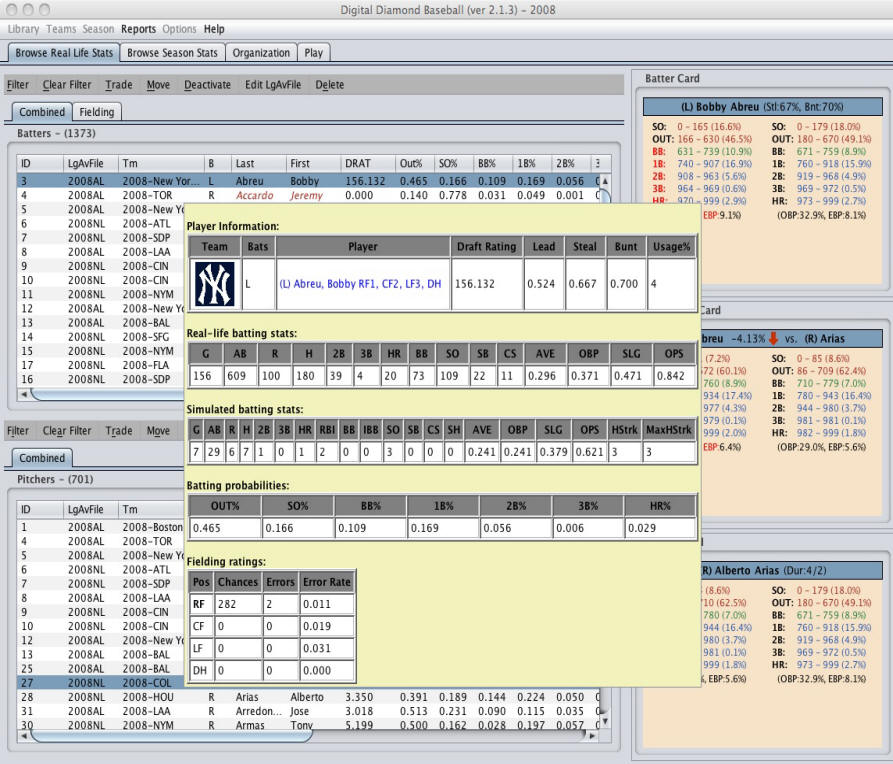
Player Pop-Ups
It is possible to view detailed information about any player listed in the Browse Real Life Stats simply by hovering the mouse cursor over a player. After a few seconds, a pop-up window will be displayed showing the player's statistical detail page.
Filtering Players
|
It is possible to filter the players that are displayed
in the batting, fielding, and pitching tables. Batters and
fielders can be filtered based on year, league, team, minimum plate
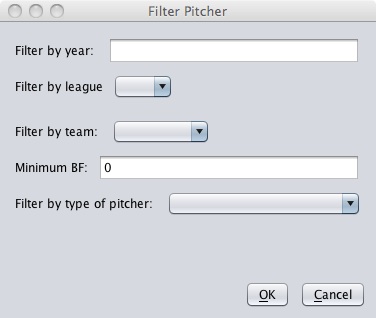
appearances, and position. Pitchers can be filtered based on
year, league, team, minimum batters faced, and if they are starting
pitchers or relief pitchers.
To filter a table click on the Filter button located at the to of the table. This will display either the Filter Batters/Fielders dialog box or the Filter Pitchers dialog box. In the dialog box, specify all of the criteria you would like use to filter the table and then click on OK. The Select Fielders button in the Filter Batters/Fielders dialog box will check all positions except for the pitcher and the Clear button will clear all positions.
If multiple criteria are specified in a filter dialog box, all criteria must be met for the player to be displayed in the table. To remove the current filter for batters or pitchers, click on the Clear Filter button located at the top of the table. |
  |
Sorting Players
The real-life batting, fielding, and pitching statistics tables can be sorted based on any of the columns in the table. Click on a column to sort the players in a table based on the date in that column. The table's contents will alternate between ascending and descending order each time the column is clicked.
Transactions
|
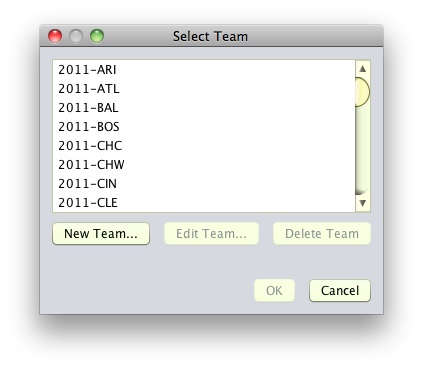
From the Browse Real Life Stats tab, it is also possible to trade, move, and deactivate players using the Trade, Move, and Deactivate buttons located at the top of the browse tables. These buttons are only enabled if one or more players are currently selected in one of the tables. If you click on the Trade button, the Select Team dialog box will appear, asking you to enter the destination team for the trade. The Select Team dialog box also makes it possible for you to edit or delete an existing team (see Editing Teams for more information). You cannot delete a team that currently contains players or has un-played games in the current schedule. After choosing the destination team, the selected players will be deactivated and copies of the selected players will be created and placed on the new team. The deactivated players will only be visible in the Browse Season Stats tab. These deactivated records preserves the players' accumulated season stats before they were traded to a new team. If you click on the Move button, the selected players will be moved to a new team. When a player is moved, their accumulated season stats are copied to the new team. However, accumulated stats on their previous team will not be preserved. As a result, the move function is perfect for placing players on different teams before the season begins, or for creating a free agent pool before conducting a draft. For more information about drafting, see Drafting Players. If you wish to create a free agent pool, you should move players to a team called FRAGENT. The drafting system treats the FRAGENT team as a free agent pool. If the FRAGENT team does not exist, you can create it using the New Team button in the Select Team dialog box. The Deactivate button will deactivate the selected players. Deactivated players are removed from the Browse Real Life Stats tab and can only be viewed in the Browse Season Stats tab. Deactivated players are shown in the Browse Season Stats tab using a light gray font and they cannot be used in games. You can reactivate players at any time from the Browse Season Stats tab (see Browsing Season Stats). Editing PlayersIt is also possible to change player's league average file or delete a player. The Delete button will delete the selected players and all of their real-life and simulated statistics. Be careful, this operation cannot be undone! The EditLgAv button will allow you to change one or more players' league average file. The league average file is the file that defines a player's peers (see League Averages for more information). This puts the player's statistics in context. Typically the league average file should match the year that the player's statistics were generated. For example, if David Ortiz is in your library and his statistics were gathered during his 2008 season, his league average file should be set to 2008. Because David Ortiz played in the American League, you may choose to set his league average file to 2008AL for added realism. |
 |